Ever feel like you are a meerkat speeding down the Spaulding Turnpike and you look down at the speedometer and notice you’re all of a sudden driving 110mph and you just know that Portsmouth Circle is coming up soon, so you hit on the breaks and slow down to 80-85mph and don’t feel like a meerkat anymore, but a tortoise?
No? Just me?
This past Wednesday morning on our Keller Williams Coastal and Lakes & Mountains KwiKStart video1, one of our brokers said a lot of Realtors have asked him, “Why are the days on market (DOM) going up? Why the heck are houses taking so much longer to sell?”
And. On the same day, Gary Keller presented his annual market update at MegaCamp. His overarching big theme claimed everyone experiences slumps—one bad year does not make a bad career.
Meanwhile, New Hampshire buyers are out here like caffeinated meerkats, popping their heads up out of their still fast-moving cars to ask if the market’s finally softening, if prices are jackknifing off the freeway, and maybe — finally — they can afford a house without auctioning off a kidney.
And yes, there is an actual measurable drop:
Dover, NH’s median price dropped ~30% year-over-year, from $600,000 in July 2024 to $420,000 in July 2025.
So that’s good news!
Right?
But, in Dover’s July history, here’s how that $420k from 2025 stacks:
-
2020: $340,000 (frenzy launch year)
-
2021: $437,500 (bidding-war puberty)
-
2022: $469,500 (maybe this is sustainable?)
-
2023 (peak): $602,500 (lol—not sustainable)
-
2024: $600,000 (flat line)
-
2025: $420,000 (OMG the crash!—except, well, read on)
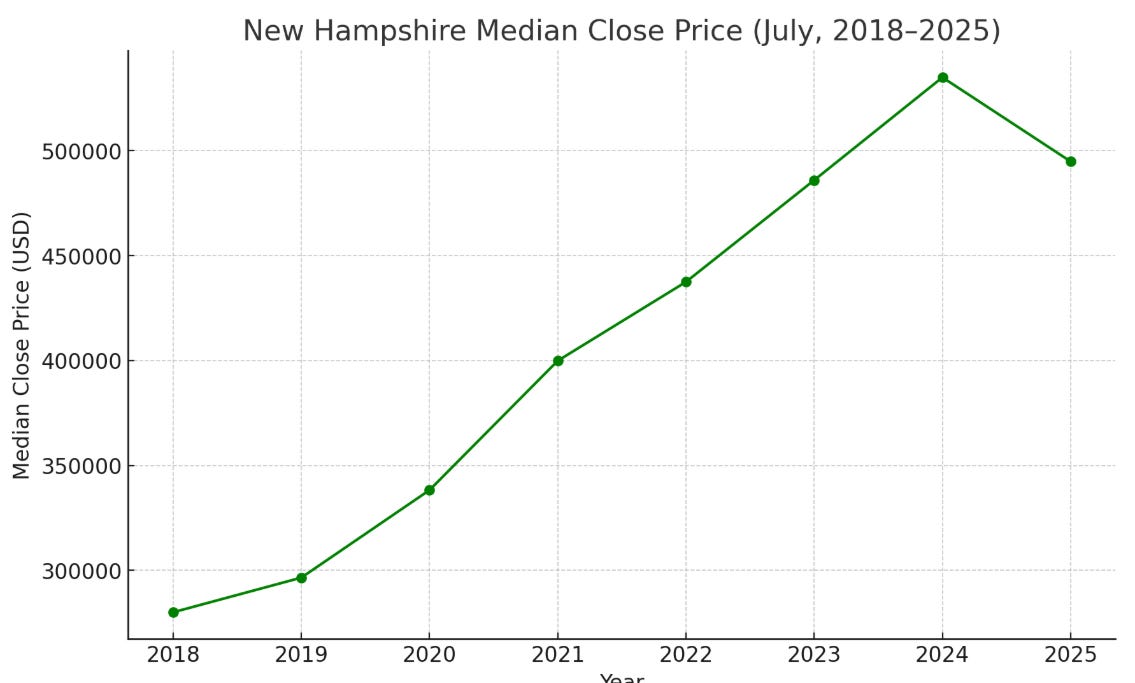
Even after that big drop from peak pandemic frenzy, $420K is still about 23.5% higher than July 2020.
And and! Get this even zanier stat, a stat so wild, it should come with a nature doc voiceover and a pile of sand for the pack of meerkats to pop up out of and blink at the TV camera: the median days on market for the NH Seacoast sat at 2 days in July 2025.
For Dover specifically?
Zero. Days.
That is not a typoe.2 I wrote that exactly right.
What I do believe is happening is a general confusion between local stats and national media outlet news. If you’ve been doomscrolling housing headlines, you’ve heard the chant:
Prices Are Dropping, Homes are Sitting, The Market’s Slowing.
The national narrative is built on a single metric: price cuts are more common than in the pandemic years. Most people in the housing conversation — agents, journalists, “market watchers” — are parroting those same single-metric headlines they’re fed, and those headlines are built for clicks, not for nuance.
“Price cuts are up!” is easy to understand, quick to screenshot, and sounds dramatic. It’s much harder to explain price cuts vs DOM vs median price vs inventory in one coherent thread3.
It doesn’t help any when national reporters work off national data that’s 1–3 months behind, so by the time the story is written and released into the wild, the actual conditions in fast-moving micro-markets like the Seacoast or anywhere else in the country are already different.
Plus, local nuance doesn’t scale. So we don’t have a clean, one-size-fits-all headline.
Let’s be honest, too. People want the real estate market to be what they feel the real estate market is — buyers want to hear it’s softening, sellers want to hear it’s hot. Headlines that affirm someone’s good (or bad) mood get shared.
And for all the real estate agents that are asking their brokers when the market is going to get better—first of all, you can’t predict the market, you can only report what’s going on in the moment, and second, most agents don’t pull their own numbers. They wait for the board or MLS to publish summaries, which often just repeat NAR talking points without always necessarily digging into the multi-year historical context.4
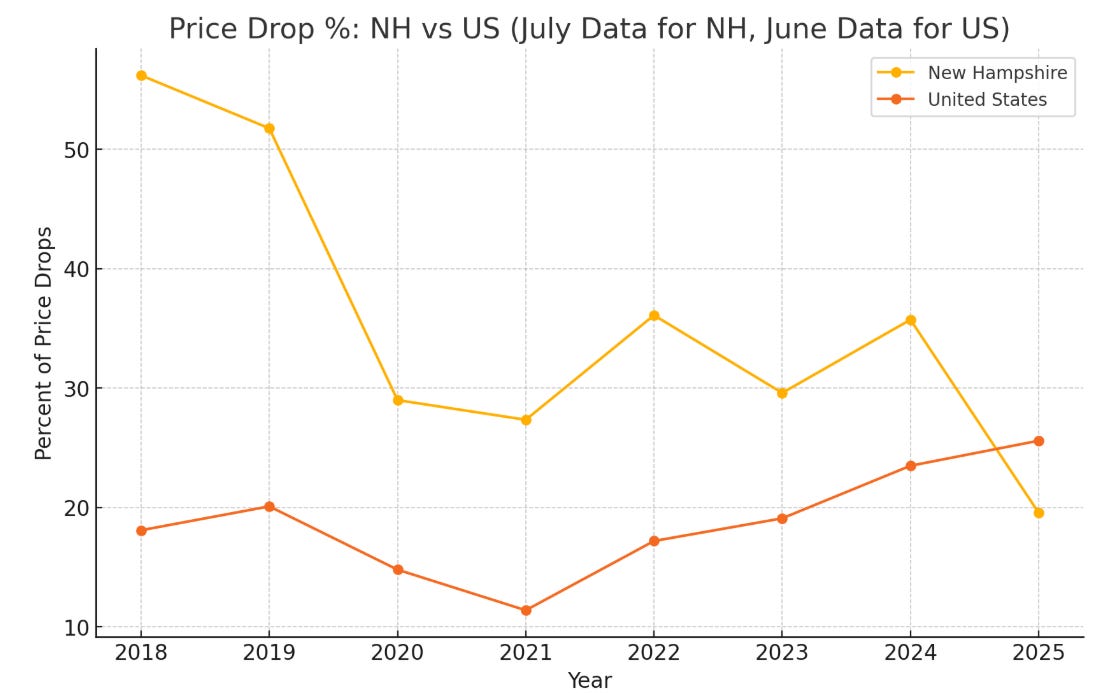
This very long table of Zillow scraped together by ResiClub, self-described as “Your data-driven gateway to the heart of the U.S. housing market,” shows the year-over-year percentage of price cuts for the top 50 real estate metro areas. You can see the increase in price drops. 18.1% of June 2018 real estate transactions in the entire United States, compared to 25.6% of June 2025.

THE NATIONAL MARKET IN ONE TABLE:
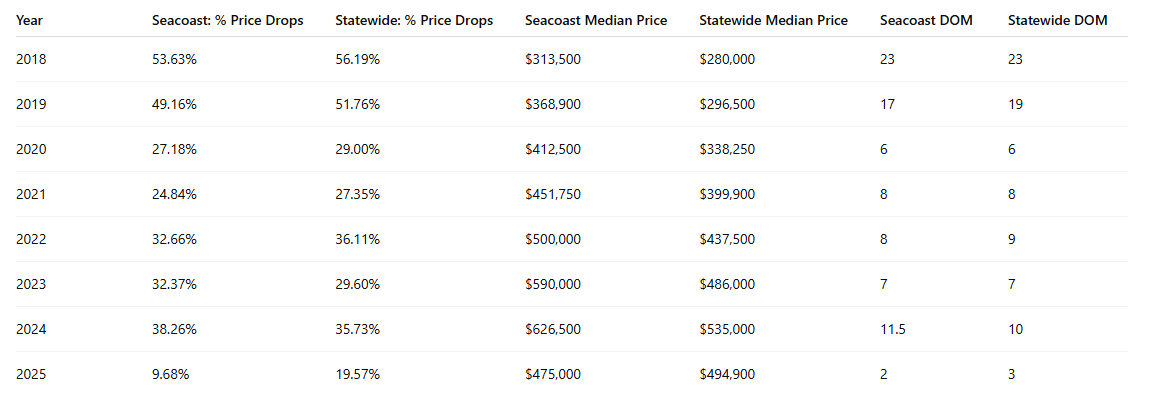
But in the entire state of New Hampshire, July-to-July, that is just not the case at all. Instead, we see a clean downward trend in the number of price cuts.
In fact, we experienced more price drops during the 2020 Pandemic than we are experiencing now.
In fact, we are still seeing continued over-asking closed prices.
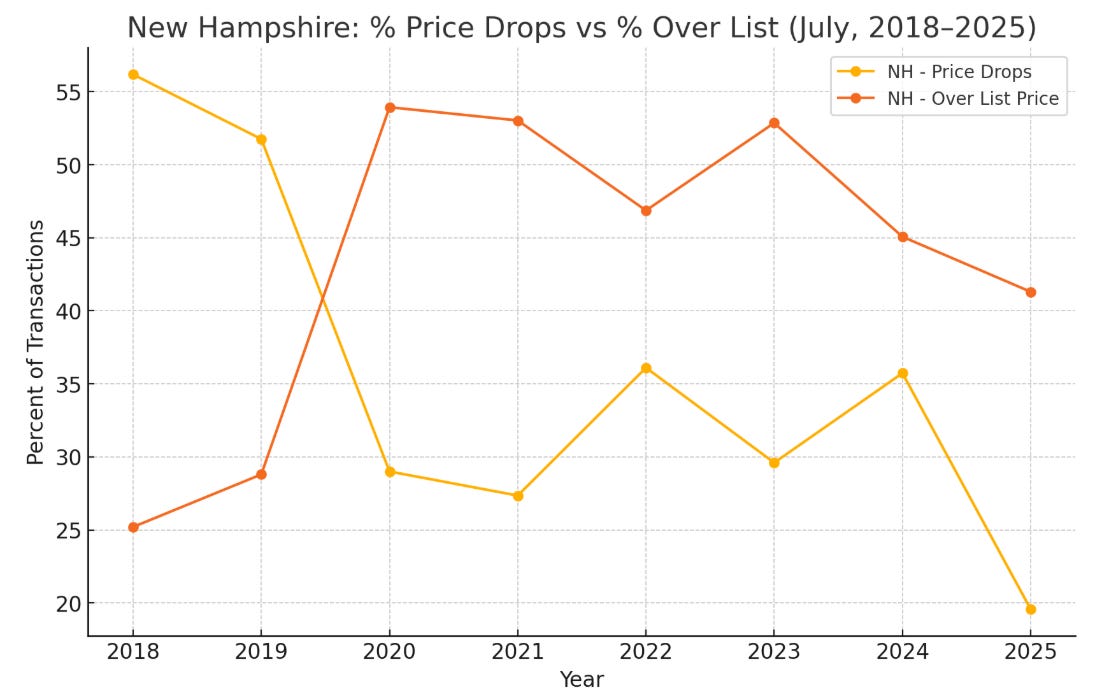
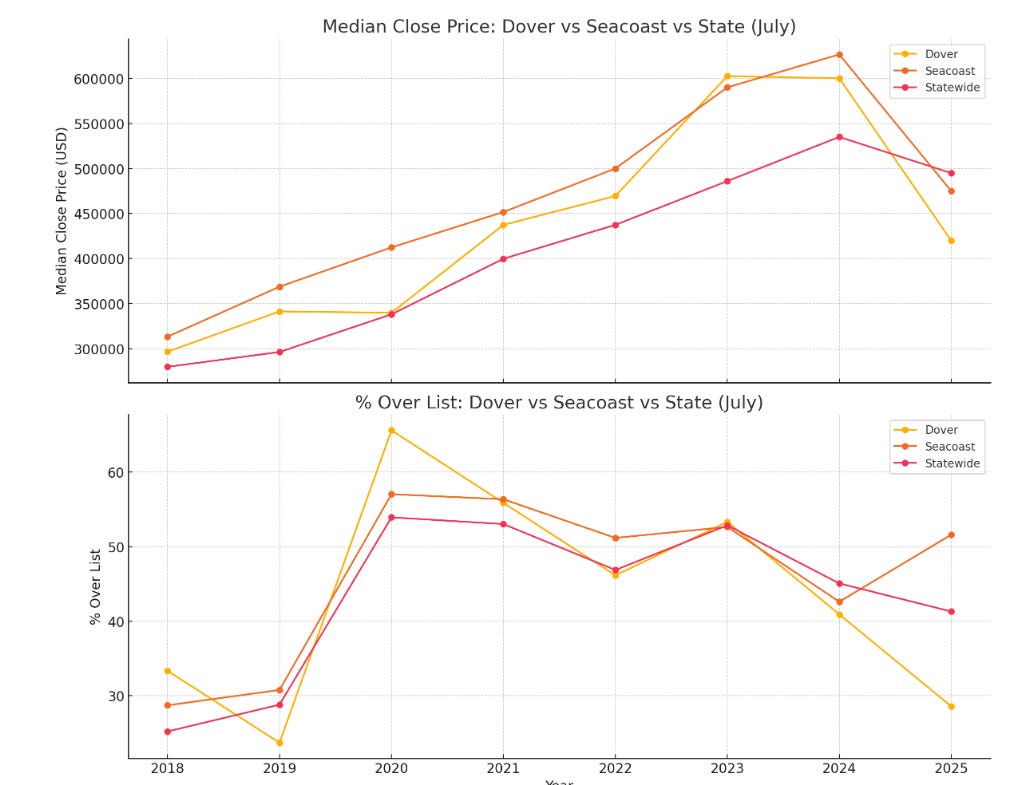
This chart above, in particular, shows how price drops ruled 2018-2019. Then Covid flipped, and over-list sales shot past 50% almost overnight, and price drops plummeted. Over the next few years, the over-listing kept a huge lead, peaking at around 53% of all listings. And yeah, now the over-asking closings are easing back, but we still see a ~20 point gap in 2025.
If the lines keep moving like this, price drops could retake the lead within the next two to three years, but right now, sellers getting more than list is still the majority story.
And, yes, again, as I said earlier, prices have dropped in New Hampshire. But we are still at the very tippy-top of that cliff.
And here’s the breakdown for July 2018-2025, comparing the seacoast to the rest of the state overall:
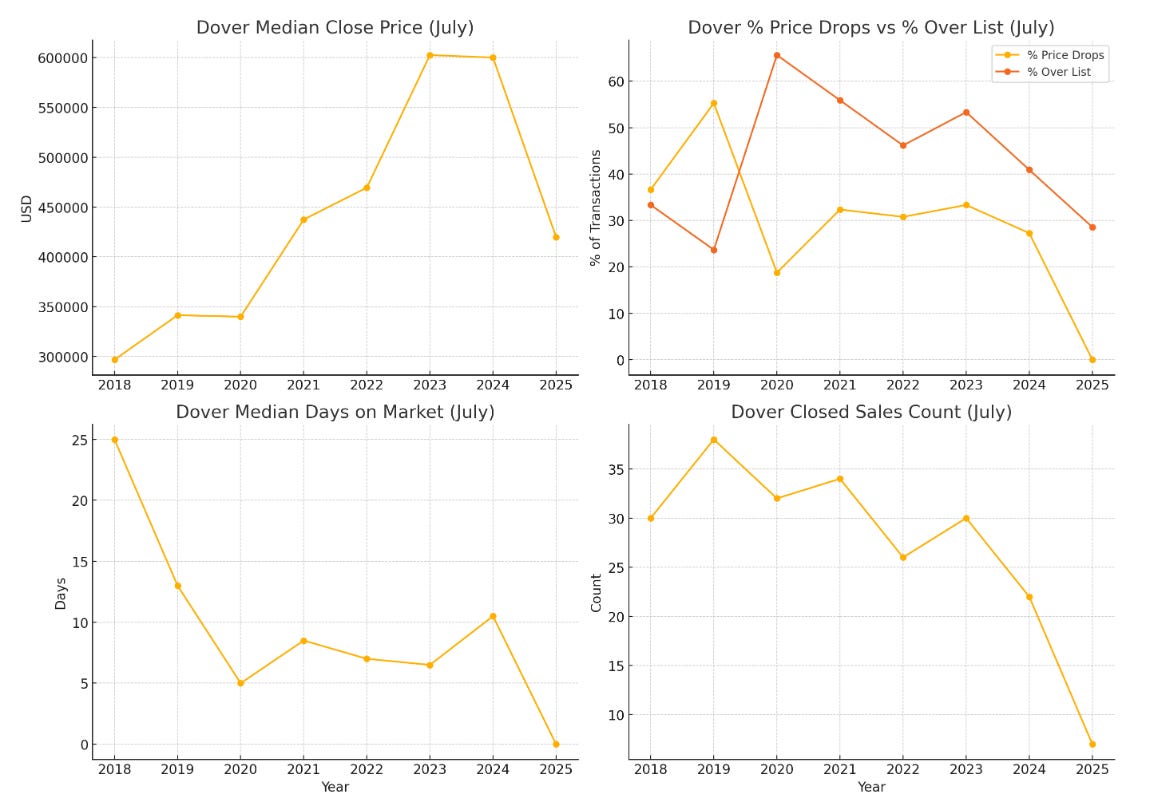
When we break this down to an individual market city—such as Dover—we can see the activity even more sharply. The 85 mph market we are in feels more like 50mph, which is so damn slow because in 2024, just a year ago, we were cruising at that 110mph.
The speed remains nuts. Pricing is still high. Bidding power is still alive.
It’s still a fight out there.
But what we are experiencing is an inventory collapse.
All those meerkats scrapping over the last cricket in the savannah —less knives, same chaos, way more dust. And as your market gets smaller, the sample size of available homes plummets:
National → New Hampshire 2,631 single-family homes → Seacoast 400 single-family homes→ Dover 45 single-family homes
So, even a single high- or super-low-priced property will completely blow the means and medians out of the water5.
Still, I think that’s the biggest (and perhaps the only) difference between the national United States real estate market data and the local New Hampshire state real estate market data.
Just the degrees are different.
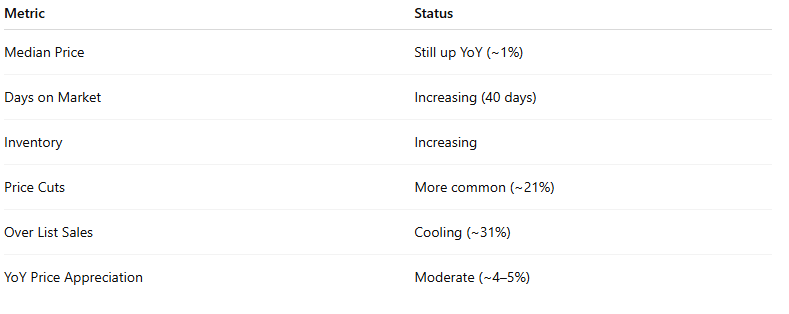
Nationally:
-
Prices ↑ year-over-year (but slower growth)
-
Price cuts ↑ from pandemic lows
-
Prices still well above the 2019–2020 baseline
-
DOM longer than in frenzy years
-
Inventory is up slightly but still below historical norms
Seacoast:
-
Prices ↑ from last year (except for a slight recent dip)
-
Price cuts ↑ from pandemic lows (but still way below national share)
-
Prices way above 2019–2020 baseline (~30% over pandemic)
-
DOM shorter than ever (2 days vs 40 nationally)
-
Inventory collapsing, not rising
The national narrative is essentially: “Market is cooling but still hot.” Our local narrative is: “Market is cooling slightly, but in the Seacoast that still means bidding wars in 48 hours, fewer price drops than most of the country, and almost nothing for sale.”6
PROPERTY OF THE WEEK AND OPEN HOUSE
11 Bunker Street, Farmington, NH
🛏️4 Beds, 🛁1 Bath, 📏1,013 sq ft, $338,000
OPEN HOUSE SATURDAY 10:00AM-12:00PM
-
Estimated payment: $2,137/mo
-
Estimation provided by Keller Williams Realty Inc.
Contact a mortgage broker today!
Welcome to this beautifully updated 4-bedroom, 1-bath home that’s truly move-in ready! Step inside to find fresh upgrades throughout, including stylish new flooring, modern lighting, and a refreshed kitchen and bathroom. The flexible layout and spacious rooms offer plenty of space to live, work, and entertain. Downstairs, a walk-out basement leads to your private backyard complete with a babbling brook—perfect for relaxing or enjoying nature. Whether you’re a first-time buyer, investor, or somewhere in between, this turnkey home offers comfort, convenience, and immediate livability. Don’t miss your chance to make it yours!
OPEN HOUSE SATURDAY, AUGUST 16, 2025 10am to 12pm.
Too many emails? You can manage your subscription here.
The Facebook Live KwiK Start video is a lot like your water cooler moment at regular, normal places of business if the water cooler were in the middle of the Kalahari, everyone stood in a loose circle on their hind legs, fur up, tails flicking, whiskers twitching, and instead of small talk about weekend plans, we hiss and chirp over market stats and too many Zillow tabs all opened at once on our computers, freeze at the faintest headline rustle, then bolt in the same direction whether there’s danger or not.
Technically, typoe is a mispelling.
I don’t seem to have that problem here, so what’s their excuse?
Except for our KW and KWCLM leadership, apex predators of the sunbaked real estate savannah. If meerkats could operate heavy machinery, track every buyer scent trail for miles, and surface from a tunnel holding a signed purchase-and-sale like it’s just another Tuesday. They are always digging deep and working at a higher level than most.
Thanks to my pre-draft readership brigade! This insight brought to you by Jan Nedelka! Want to be on this list? You get real estate data way before anyone else, first to see my upcoming Wicked Moxie interviews with cool New Hampshire people, and get to correct all my grammar! And, I have three English degrees, so think about those bragging chomps.
If we’re hunting for a real estate market disruptor, it’s not going to be a single rate cut or a few hundred new listings. It’ll take something bigger, like a full-blown economic derailment, another inflation wave, or a shock flood of inventory. And yes, Dover’s 1,440 new units over the next few years is nice, but New Hampshire as a whole needs 600,000 by 2030. That’s only five years away, which in development terms is basically tomorrow. In meerkat years, that’s the time between spotting a predator and realizing your tail has already been chewed.*
* Once the “truth infrastructure” is corroded, whether it’s MLS housing data, GDP reports, or crime stats, markets start pricing in noise, and the noise can derail the economic machine**.
** Here’s the chain:
-
Undermine the data sources
– Politicians discredit or dismantle agencies like the Bureau of Labor Statistics, CDC, or even local housing data providers.
– Public health stats, job numbers, inflation metrics, or housing starts become “fake news” in the official narrative. -
Replace facts with politically useful stories
– Crime is “out of control” even as it drops.
– The economy is “booming” even as job growth stalls.
– The housing market is “flooded with inventory” when the real supply shortfall is still massive. -
Market actors shift decisions based on the false narrative
– Buyers hold off because they “know” prices will crash soon (even if supply is tight).
– Investors pull capital from sectors they think are “doomed” based on manipulated data.
– Governments enact policy to “solve” problems that don’t exist (e.g., cracking down on “excess” housing supply when the shortage is real). -
Self-fulfilling disruption
– Distrust depresses demand in some markets, creates panics in others.
– Businesses and consumers stop making long-term plans because they can’t trust the playing field.
– In housing, misinformation about supply/demand dynamics can freeze transactions, which actually does slow the market and ripple into construction, lending, and local economies. -
Cascade into macroeconomic instability
– Capital flight from uncertainty.
– Policy whiplash as each administration rewrites the rules based on “their” numbers.
– International investors lose faith in U.S. stability because no one agrees on the fundamentals.
For more reading on the fragility of systems that rely on trust in shared information systems and what happens when that trust is undermined, whether by politicians, algorithms, speculative markets, or industry missteps, see:– Paul Krugman, Trump Plays the Carnage Card
– Paul Krugman, MAGA’s Feelings Don’t Care About Your Facts
– Kyla Scanlon, How AI, Healthcare, and Labubu Became the American Economy
– Kyla Scanlon, Zero-sum Thinking and the Labor Market
– Rob Hahn, Business Insider Makes the Best Case Yet for Government Takeover of the MLS